As additional coursework, I wrote a recommendation paper for Bloomington’s local PBS station to act as a guideline for their social media accounts. Based on industry research, best practices among similar organizations, and personal insights, the paper outlined goals that may be accomplished through social media, implementation suggestions, and brief comparative case studies of four PBS stations’ social media initiatives. The final document was delivered to the WTIU program director and sent to the marketing director, although I am not aware whether any recommendations have been implemented.
Samples from the paper are below, and the full document can be read here: Social Media Recommendations for WTIU, as well as just the case studies: Social Media Recs for WTIU: Case Studies.
Strategy
As with any marketing plan, the strategy used by WTIU will depend on the goals set out by the organization, which may include:
- To drive traffic to the WTIU website
- To increase the number of unique connections online
- To increase the size of WTIU’s influence online
- To increase viewership of WTIU programming
For example, if a main goal of social media for WTIU is to increase the size of WTIU’s influence online, the following strategy may be useful:
There is not yet an all-encompassing yardstick with which to measure influence online, it is often agreed by those who study social media use in organizations that social media analysis should not stop at counting the number of ‘friends’ or ‘followers’ across accounts.[1] Quantifying reach in this way does not make a distinction between those connections who have frequent, meaningful interactions with the WTIU brand and those who are ‘lurking’ without contributing to the conversation. Facebook has begun to address this issue by adding the number of users who are “talking about this” to an organization’s Facebook page, to compare to those who only “like this.”
Additionally, some connections are inherently more valuable than others due to the size of a connection’s network—the potential amplification of a message retweeted by a Twitter follower who has 300 followers is much higher than one who only has five. Klout (www.klout.com) is one tool that is attempting to quantify social media success in this way, with measures of “True Reach” (the number of people you can influence across your direct connections and their networks), “Amplification” (the likelihood that your network will respond to a message, and how close you are to your network overall), and “Network Impact” (the influential power of your connections).[2] For example, Indiana Public Media is already registered on Klout and has a True Reach of 204, Amplification of 5, and Network Impact of 18 (as of December 10, 2011). While this information alone may not be actionable, administrators can view how the organization’s scores have changed over time and why, to try and craft a plan that will steadily increase the scores that are deemed most beneficial.
[1]Smith-Robbins, Sarah. Personal interview. 3 October 2011. [2]“The Klout Score.” Klout. Klout, Inc., n.d. Web. 1 December 2011.
Implementation
It’s already almost becoming cliché to say that social media is all about conversations and engagement—it is not yet another way to push a marketing message onto an unwilling audience. Consumers rarely wonder who wrote the copy for the billboard they pass on their way into work, or who came up with the concept behind the commercial they have to sit through during their favorite show. But because social media is used by individuals and companies in much the same way, users may expect a more personal interaction within social networks. Who is writing these Facebook updates? Is it a real person thinking through each Tweet?
To encourage personal interaction, multiple employees may be given access to the organization’s social media accounts and empowered to post often. However, a consistency of tone and voice should be managed by providing guidelines to employees, or by funneling all interactions through one social media manager to approve before posting. Consistency in the amount and frequency of posts is also important, to provide a steady stream of updates that neither overwhelms nor bores users.
Although Facebook and Twitter are currently the most popular social networks, niche networks may provide additional connections with users if used strategically, such as:
- Foursquare: employees could “check in” to local restaurants and events from the WTIU account to reinforce the organziation’s connection to the community.
- Goodreads: WTIU could create reading lists for viewers who want to learn more about a program–many documentaries are based on a nonfiction book, and many PBS programs have companion books.
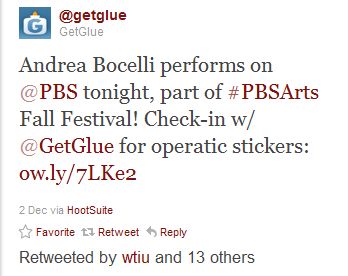
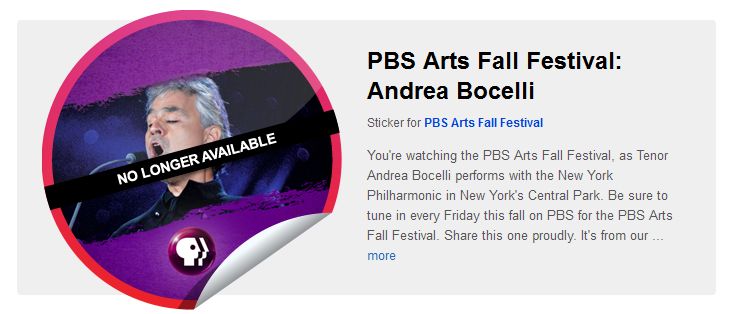
- GetGlue: similar to Foursquare, GetGlue is a social check in application specifically for media. Users can earn “stickers” (both virtual and physical) for noting that they are watching a program, and can discuss the program with other viewers. PBS has a relationship withGetGlue to provide branded “stickers” to viewers, and WTIU could encourage local viewers to check in and share their stickers on Twitter or Facebook.
Case studies
Social media marketing is still in its experimental stages—it’s hard to pinpoint whether a campaign was successful, much less what made it successful. However, it may be useful to see how similar organizations are using social media to set benchmarks for WTIU’s efforts, look for trends (the popularity of which alone may be a mark of success), and to find any unique uses of available tools that may be tested with the WTIU audience.
Three Public Broadcasting Stations (television) were reviewed based on their representation of different sizes of audiences and apparent stages in their social media use (some seem to have a much more concrete strategy than others). A similar analysis of WTIU’s current activities was conducted for comparison.
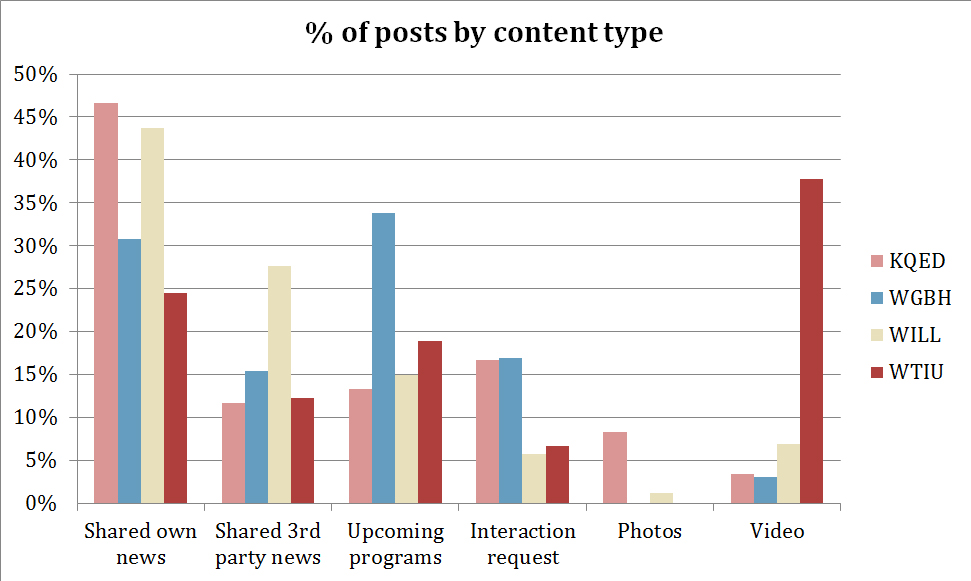
One interesting observation arises from comparing the types of content shared by the four stations, as shown in the chart below. It seems a balance between content types leads to a rich user experience, and is demonstrated by KQED–a San Francisco station that has an active (and seemingly successful) social media presence.
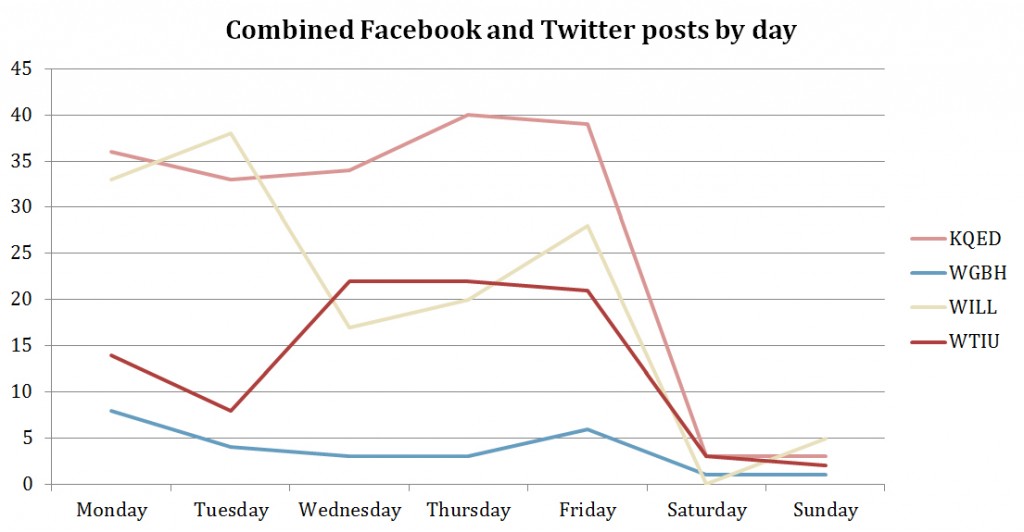
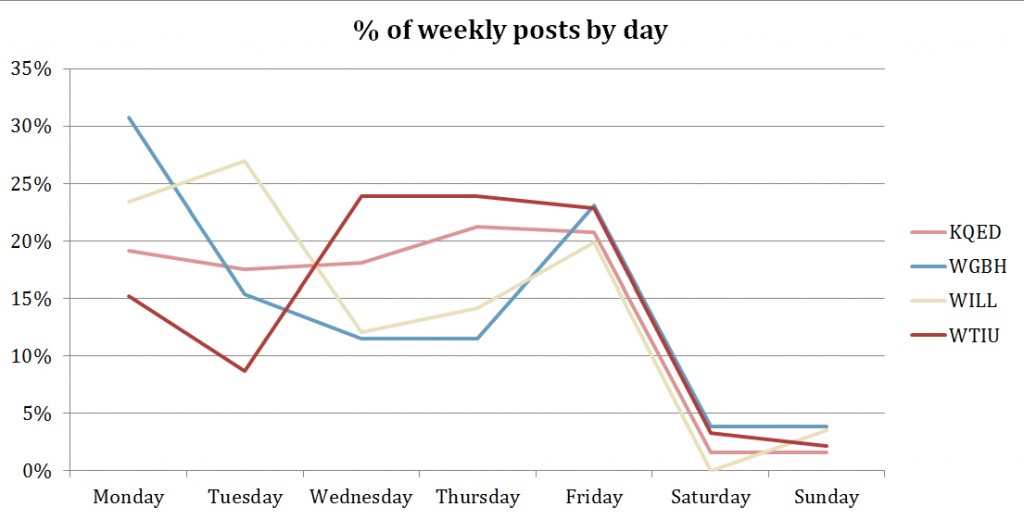
The frequency of posts per day also shows that the most successful campaigns are the most consistent. The first chart below shows the absolute number of posts on Facebook and Twitter per day and the second chart normalizes the frequency by showing the percentage of weekly posts that occur on each day for the four stations. When the weekend days are removed in the third chart, it becomes clear that KQED is fairly consistent with posts over the week, and may be used as an example for WTIU.


